htop configuration
This post is more of a personal reminder than anything else. And it’s a reminder on how to configure htop.
When using the CLI on local machine or remote servers, it’s quite often interesting to see which processes are running and which ones are using a lot of resources. The traditional utility for that in the Unix world is called top and is a bit limited.
Another tool, available in most linux distributions is htop which is a bit more powerful. Still, sometimes I need more information than provided by htop by default, so I also use glances. But that one seems a bit slow, brings a lot of dependencies and I don’t like running two software to do mostly the same thing.
Until I realised that htop mostly does what I want… that’s the thing when using a software for ages and not looking at the new features.
So, what do I want that is not in htop’s default configuration?
- CPU temperature
- CPU frequency
- Network bandwidth
- Disk IO usage
- Per process:
- Disk IO rates
- Total disk read/write
- Network bandwidth
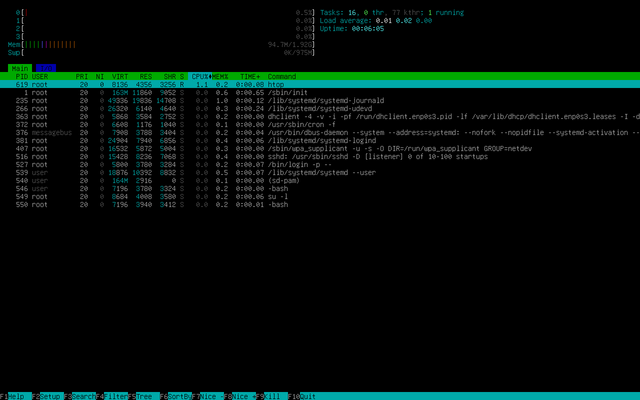
On a fresh minimal debian installation, installing htop takes 387 kB of space (according to apt) while installing glances takes 930 MB (I guess it’s mainly because it requires installing python). And it looks like that:
Recently I saw this new IO tab, making me think that htop is able to display some of the information I’m interested in. And that maybe it’s a good time to see what are the new options available.
So, press F2 for setup, and right away in Display options there are 2 options I want:
- Also show CPU frequency;
- Also show CPU temperature
That second option requires installing libsensors: sudo apt install libsensors5 which bring an additional 123 kB of disk space usage…
still far away from what glances requires.
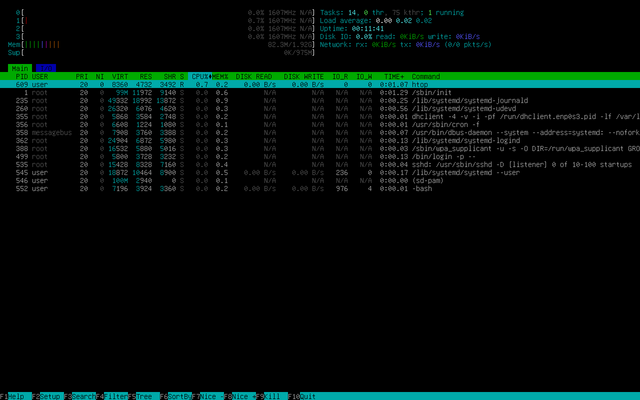
So now we can see those 2 new information per core:
Back to Setup, the Meters section allow to configure the top headers.
Again, to more information I’m interested in:
- Disk IO
- Network IO
So here are the global disk and network information:
Now in the Screens section:
- RBYTES
- WBYTES
- IO_READ_RATE
- IO_WRITE_RATE
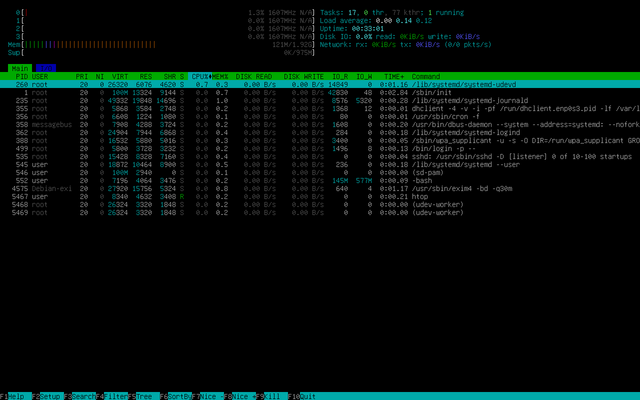
But, as we can see, the new columns display data only for my user.
And my user is not allowed to read that kind of information on other users’ processes.
One solution would be to run htop with sudo but that’s not a great solution.
A better one is to give htop the capability to do that.
It turns out we can do that in linux.
First find out where htop is:
user@debian:~$ whereis htop
htop: /usr/bin/htop /usr/share/man/man1/htop.1.gz
Then give it the necessary capabilities (I can’t remember where I found that, but kudos to whomever I copied it from):
sudo setcap 'cap_sys_ptrace=ep cap_dac_read_search=ep' /usr/bin/htop
So now I’m only missing the network bandwidth per process. There’s an open feature request for that, hope it will be done at some point.


